Simulation as A Tool for Productivity Modeling of Precast Concrete Installation
Ali Najafi1 * and Robert Tiong1
http://dx.doi.org/10.12944/CWE.10.Special-Issue1.23
Construction simulation is a technique that is mainly used to assess the productivity of repetitive construction operations. Therefore, this technique was applied in this study to evaluate the productivity of horizontal precast concrete (PC) installation. The installation of 70 PC panels (beams and slabs) were observed and a WEBCYCLONE model was developed. The analysis showed that the developed model was able to provide valid estimates of the actual installation times with acceptable percentage error (7.61 percent). Additionally, based on the results from resource utilization, construction managers and site supervisors can provide more efficient labor planning for daily activities.
Copy the following to cite this article:
Najafi A, Tiong R. Simulation as A Tool for Productivity Modeling of Precast Concrete Installation. Special Issue of Curr World Environ 2015;10(Special Issue May 2015). DOI:http://dx.doi.org/10.12944/CWE.10.Special-Issue1.23
Copy the following to cite this URL:
Najafi A, Tiong R. Simulation as A Tool for Productivity Modeling of Precast Concrete Installation. Special Issue of Curr World Environ 2015;10(Special Issue May 2015). Available from: http://www.cwejournal.org/?p=10322
Download article (pdf)
Citation Manager
Publish History
Introduction
Discrete event simulation is a well-established approach in the field of construction engineering and management (Martinez and Ioannou, 1999). Simulation is an effective tool to be used for the planning purposes in the feasibility studies as well as during project execution. There are several simulation packages designed for the construction industry. Probably, the most famous one is CYCLONE developed by Prof. Halpin in 1970s and since then there are many advancements in CYCLONE based systems such as MICROCYCLONE (Halpin and Riggs, 1992), DISCO (Huang and Halpin, 1993), and STROBOSCOPE (Martinez, 1996) which is capable of modeling more complex construction operations.
There are several studies that have utilized simulation as a tool for analyzing different construction management problems. As an example, simulation has been used to assess the productivity of laying water mains (Tam, 2010), modeling of public housing construction (Shi et al., 1998), resource management of bridge deck rehabilitation (Zhang et al., 2008), concrete batch plant operations (Zayed et al., 2005), and pile construction productivity assessment (Zayed and Halpin, 2005).
Construction simulation is a technique that is mainly used to assess the productivity of repetitive operations. Hence, this technique was applied in this research to evaluate the productivity of horizontal precast concrete (PC) installation, which is a highly repetitive task. In order to apply this technique for productivity assessment, the duration of each activity should be defined in a deterministic or probabilistic approach. The following steps are required to use simulation technique for productivity assessment of PC installation:
- Select an appropriate simulation program (package).
- Model PC installation process based on the selected simulation package.
- Determine the duration of PC installation activities (this may require finding the distribution of the data for each activity).
- Run the simulation model.
- Analyze and validate the simulation results.
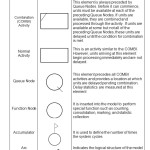
In this study, WebCYCLONE that is based on MicroCYCLONE (Halpin and Riggs, 1992), was used to model and simulate PC installation process. The basic elements of WebCYCLONE that are necessary to model PC installation process are shown in Table 1.
 |
|
Methodology
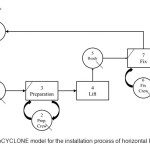
Based on the selected simulation package (WebCYCLONE), the model that is shown in Figure 1 has been developed to represent the installation process of PC elements. The following notes should be considered to describe the model:
- The crane (tower or mobile) and preparation crew should be available as shown in nodes 1 and 2.
- The crew will prepare the element as shown in node 3.
- The crane lifts the element to the designated point (node 4).
- The fixing crew should be available to adjust and fix the element at the installation point. These are shown at nodes 6 and 7.
- After the element is fixed, the crane returns to begin the next cycle (node 8).
- Node 9 shows the location of the counter that is before the beginning of the next cycle.
- The following resources are available: 1 crane at node 1, preparation crew (usually one labor only) at node 2, and fixing crew (4-6 labors) at node 6.
- Node 5 is a dummy node which is required to model node 4 and 7. The reason is that in WebCYCLONE modeling, a normal element (node 4: lift) cannot be directly followed by a COMBI element (node 7: fix). Therefore, a dummy QUE node is added.
 |
|
The installation activities of about 70 horizontal precast concrete (PC) elements including beams and slabs were observed at different construction sites across Malaysia and Singapore. General characteristics of these elements are shown in Table 2.
Table2: General characteristics of PC elements
|
Beam |
Slab |
|
|
No. of cases |
26 |
44 |
|
Length (m) |
5.57 – 9.22 |
2.40 – 8.73 |
|
Width (m) |
0.30 – 0.80 |
0.37 – 2.40 |
|
Height (m) |
0.32 – 0.60 |
0.07 – 0.27 |
|
Weight (t) |
2.06 – 5.66 |
0.80 – 3.09 |
60 PC elements were randomly selected to build the simulation model and the remaining PC panels were kept for the validation purposes to be compared with the actual installation times and therefore, finding the appropriateness of the developed model.
Results and Discussions
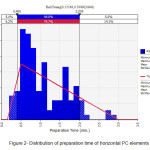
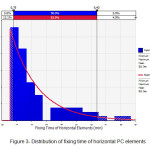
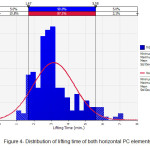
In order to find the distribution of different installation activities, @Risk software version 5.5 was used[1]. The distribution of preparation, lift, and fixing activities for horizontal elements are shown in the following figures.
Based on the results from @Risk software, the duration of preparation and fixing activities follow triangle and exponential distributions as shown in Figure 2 and Figure 3. Note that the characteristics of the fitted distributions are shown at the legend of these figures. The lifting times follow the normal distribution as shown in Figure 4.
[1] Note that @Risk software provides different distributions. Therefore, the best fitted distributions that can be used in Web CYCLONE have been selected.
 |
|
 |
|
 |
|
Since the distributions of duration of different activities have been defined, the next step is to run the simulation model and evaluate the results. Table 3 shows Chi-Square Statistics and p-values of the fitted distributions for different precast operations for horizontal elements (provided by @Risk software). Based on the results, p-values of the Chi-Square test for almost all the fitted distributions are more than 0.05, which shows that they look valid. The only exception is the result for the test of lifting time, which can be considered to be valid as well if the significant level of 0.01 is chosen.
Table3: Chi-Square goodness of fit test
|
Data |
Chi-Square Statistic |
P-Value |
|
Preparation time of horizontal elements |
12.82 |
0.23 |
|
Fixing time of horizontal elements |
11.25 |
0.26 |
|
Lifting time of horizontal and vertical elements |
28.84 |
0.011 |
To evaluate the performance of the developed simulation models, the results should be compared to the actual data. A quick way to analyze the performance of the simulation model is to run the developed WebCYCLONE models (10 cycles for horizontal elements) and then sum the total installation times obtained from the simulation results. This result will be compared to the sum of the total installation times of the actual data collected from the construction sites.
Based on the above mentioned procedure, the sum of the total installation times of the actual data equals to 61.8 minutes. The results from the simulation models show that the sum of installation times equals to 66.5 minutes. Therefore, Mean Absolute Percentage Error is 7.61 percent, which shows a very good estimation of the total installation times of PC elements.
To check the statistical characteristics and compare the means between actual and simulation data, Independent Samples T-Test is performed and the results are provided in Tables 4 and 5.
Table 4: Statistics of the actual and predicted installation times of the horizontal elements provided by the simulation model
|
Group |
N |
Mean (min.) |
Std. Deviation |
Std. Error Mean |
|
|
Installation Time |
Predicted |
10 |
6.65 |
2.982 |
.943 |
|
Actual |
10 |
6.18 |
1.91 |
.472 |
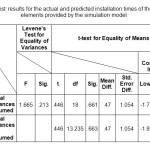 |
|
Table 5 shows that the p-value of the Levene’s test for equality of variance is 0.213 which is more than 0.05. This means that the variances are not different at α = 0.05 and the groups (actual and predicted installation times) are homogeneous. Since the equality of variances is assumed, the p-value of the T-Test for equality of means is 0.661 which is more than 0.05. Furthermore, 95 percent confidence interval of the difference contains zero. The above mentioned results show that, there is no statistically significant difference between the means of the predicted and actual installation times of the construction simulation model for the horizontal elements.
One of the most useful results from the construction simulation is the analysis of the resource utilization which provides valuable information that can be directly used in more efficient resource planning. The analysis regarding resource utilization for PC elements are shown in Table 6.
Table6: Analysis of resource utilization for installation of horizontal elements
|
PRECAST ERECTION PROCESS FOR HORIZONTAL ELEMENTS |
||||||
|
CYCLONE PASSIVE ELEMENTS STATISTICS INFORMATION |
||||||
|
Type |
No. |
Name |
Times not empty |
% Idle |
Total Simulation Time |
Average Waiting Time |
|
QUEUE |
1 |
CRANE |
0 |
0 |
66.5 |
0 |
|
QUEUE |
2 |
PREP CREW |
56 |
84.21 |
66.5 |
4.7 |
|
QUEUE |
5 |
READY |
0 |
0 |
66.5 |
0 |
|
QUEUE |
6 |
FIX CREW |
47.5 |
71.36 |
66.5 |
4.3 |
Based on the results, during the installation of horizontal elements, preparation crew labors are idle for 84.21 percent of the time and the percentage of idle time for fixing crew labors is 71.36 percent. These results provide valuable information for site supervisors and construction managers for efficient “labor planning.”
Conclusions
In this study, construction simulation technique was used to analyze the productivity of the installation operations of horizontal precast concrete elements. The installation of 70 pc elements including beams and slabs were observed at several construction sites across Singapore and Malaysia. A WEBCYCLONE model was developed and @Risk software was used to determine the distribution of the data for each activity involved in the installation process. Based on the validation procedure, the results showed that the Mean Absolute Percentage Error (MAPE) was 7.61 percent, which shows a very good estimation of the actual installation times of PC elements. Furthermore, the analysis of the resource utilization showed that during the installation of horizontal elements, preparation crew labors were idle for 84.21 percent of the time and the percentage of the idle time for fixing crew labors was 71.36 percent. Site supervisors utilize these types of information for more efficient labor planning.
References
- Halpin, D. W. and Riggs, L. S. Planning and Analysis of Construction Operations (John Wiley & Sons, 1992).
- Huang, R. and Halpin, D. Dynamic Interface Simulation for Construction Operations (DISCO). Automation and Robotics in Construction, 10, 503-513(1993).
- Martínez, J. C. STROBOSCOPE: State and Resource Based Simulation of Construction Processes (PhD Thesis, University of Michigan Ann Arbor, 1996).
- Martinez, J. C. and Ioannou, P. G. General-Purpose Systems for Effective Construction Simulation. Journal of Construction Engineering and Management, 125 (4), 265-276(1999).
- Shi, J. J.; Zeng, S. and Tam, C. M. Modeling and Simulation of Public Housing Construction in Hong Kong. Proceedings of the 30th Conference on Winter Simulation, IEEE Computer Society Press (1998).
- Tam, C. Using Construction Process Simulation to Assess Productivity of Laying Water Mains in Hong Kong. Proceedings of the 27th International Conference of the CIB W78, Cairo, Egypt (2010).
- Zayed, T. M. and Halpin, D. W. Productivity and Cost Regression Models for Pile Construction. Journal of Construction Engineering and Management, 131(7), 779-789(2005).
- Zayed, T. M.; Halpin, D. W. and Basha, I. M. Productivity and Delays Assessment for Concrete Batch Plant-Truck Mixer Operations. Construction Management and Economics, 23(8), 839-850(2005).
- Zhang, C.; Zayed, T. and Hammad, A. Resource Management of Bridge Deck Rehabilitation: Jacques Cartier Bridge Case Study, Journal of Construction Engineering and Management, 134 (5): 311-319(2008).


